Comparing May 3-June 2 with June 3-July 3, 2026, Level Up Basketball recorded 211% more Google Search Console clicks, 148% more Search Console impressions, and 56% more GA4 organic sessions; these observations are evidence, not a guarantee or proof of a single cause.
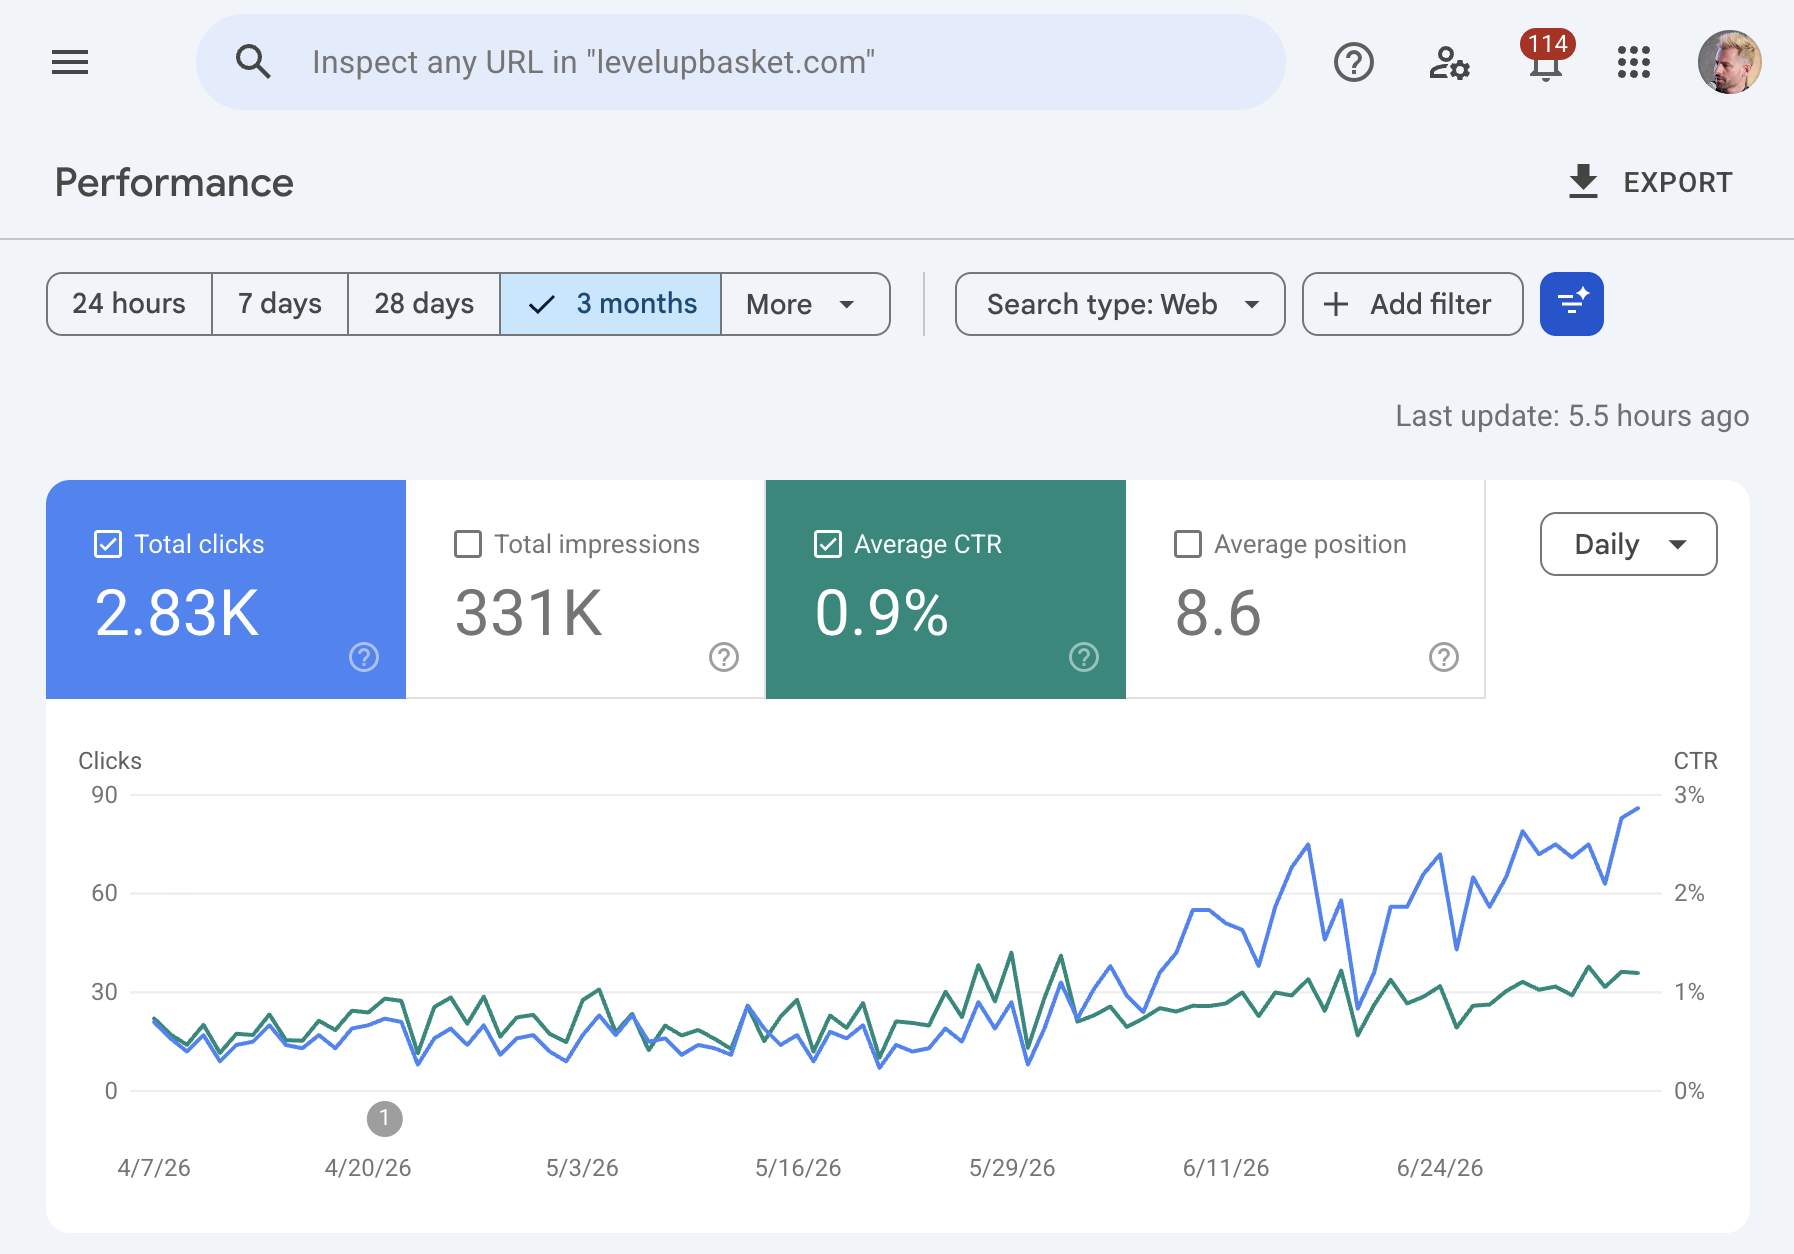
Level Up Basketball is the production environment where Level Up Factory observes its search and publishing operating system under real conditions. This case study reports a defined comparison from public claims and keeps the interpretation narrower than the numbers.
Context, work, and ownership
Level Up Basketball is a Level Up-owned property and the live experimentation and validation environment for the Factory’s search operating model. Level Up Factory owns the evidence and publication decision for this first-party case study.
The earlier window, May 3-June 2, 2026, is the stated comparison baseline. The public work context is a governed search and content operating loop in which changes are structured, checked, shipped, and measured. This case study does not assign the percentages to a single page, tactic, or release because the public evidence does not support that narrower attribution.
Direct result
For the comparison of May 3-June 2, 2026 with June 3-July 3, 2026:
- Google Search Console clicks increased 211%
- Google Search Console impressions increased 148%
- GA4 organic sessions increased 56%
These are period-over-period observations from two different measurement systems. They are evidence that organic search visibility and traffic were higher in the later period. They are not a guarantee that the same result will occur for another site, and they do not by themselves prove that one change caused the increase.
What the comparison contains
The date windows are adjacent and equal in length:
| Source | Metric | Later period compared with earlier period |
|---|---|---|
| Google Search Console | Clicks | +211% |
| Google Search Console | Impressions | +148% |
| GA4 | Organic sessions | +56% |
Search Console and GA4 answer different questions. Search Console reports interactions with Google Search results. GA4 reports sessions observed on the site under its analytics configuration. A Search Console click is not the same event as a GA4 session, so the percentages should not be forced into a one-to-one reconciliation.
Why the evidence is useful
Clicks, impressions, and organic sessions all moved upward in the later window. Looking at more than one metric and more than one system gives a more useful read than presenting a single chart in isolation.
The comparison is also reproducible: the sources, metrics, and date windows are named. A future reviewer can return to the same systems, apply the same periods, and inspect whether the public summary matches the underlying reports.
That reproducibility is part of the Search Agent Optimization operating model. Search work is connected to sources and measurement rather than remembered as a sequence of prompts.
What this case study does not claim
This readout does not claim:
- That a single page, release, or technical change caused all of the growth
- That every query, page, country, or device improved by the same amount
- That the later period predicts future performance
- That Search Console and GA4 measure identical users or events
- That another company should expect the same percentages
- That rankings or traffic can be guaranteed
Search behavior can be influenced by seasonality, branded demand, product and marketing activity, search-system changes, competitor changes, measurement configuration, and the mix of queries and pages. A responsible analysis examines those factors before making a stronger causal statement.
How Level Up Factory uses the result
The result is a signal for continued investigation and operating decisions. The next useful questions are at page and query level:
- Which pages contributed most to the click and impression changes?
- Did branded and non-branded patterns move differently?
- Were changes broad or concentrated in a small number of queries?
- Did device, country, and search appearance mixes shift?
- Did GA4 landing-page behavior align with the Search Console pattern?
- Were releases, campaigns, tracking changes, or external events recorded during either period?
Those questions help decide whether to update, expand, consolidate, or simply continue observing. They also prevent a portfolio-level percentage from becoming an unsupported page-level story.
Why this matters for buyers
The value of a search operating system is not that it can produce a dramatic chart on demand. The value is that it can connect approved sources, structured publishing, release history, technical checks, and measurement well enough for a team to learn from what happened.
For consumer products, that system is described in the consumer apps solution. B2B teams can review the B2B SaaS solution. Both use the same evidence discipline even though their buyers and conversion paths differ.
Evidence and sources
The visual evidence at /assets/gsc-growth-2026-07-08.png was captured from Google Search Console on July 8, 2026 and shows the search-performance trend around the comparison windows. The approved metric record in docs/evidence/level-up-basketball-organic-search-growth.md supplies the ownership, sources, and publication boundaries for the +211% clicks, +148% impressions, and +56% GA4 organic sessions claims; the screenshot alone does not display all three calculations. Level Up Factory is the evidence owner, and the underlying reports, filters, and calculations remain private review material.
The reporting rules used to interpret these observations are documented in How Level Up Factory evaluates search changes. Any future update to this case study should preserve the original windows, name the new comparison separately, and avoid overwriting historical evidence with a later snapshot.
The relevant commercial path is the client-owned AI SEO/SAO Agent Installation.